


2023 State of the Industry Report
Companies that buckle up for a bumpy ride may cross the finish line in good positions.
At first glance, the outlook for 2023 may appear bleak. Many economists envision a downturn in global gross domestic product accompanied by recessions in the United States and Europe. The Federal Reserve predicts a larger hike in interest rates this year than initially planned. In addition, the war between Russia and Ukraine, as well as China abandoning its zero-COVID policies, create uncertainties in the market. However, it’s not all doom-and-gloom for the composites industry.
Composites Manufacturing magazine asked consultants to share their outlook for composite materials and end-use products this year and beyond. It’s a mixed bag, but there’s reason for optimism.
The Aerospace Market
By Richard Aboulafia, Managing Director
AeroDynamic Advisory
Aerospace markets are mostly in very positive territory. That’s the good news. The bad news is that because of supply chain disruptions, industry output has become de-linked from market health. The deliveries recovery is much slower than hoped as a result.
First, markets. Thanks to Russia’s war on Ukraine and ongoing tensions in the Western Pacific, global defense spending is at a high, exceeding $2 trillion worldwide for the first time in 2021. We see it growing at about 5% per year, although inflation complicates buying power. Combat aircraft markets are in particularly good shape, as major powers need to re-equip their militaries to deal with peer adversaries, rather than counter-insurgency operations and low intensity warfare.
Single aisle commercial jets are the biggest civil segment, and demand is quite strong. These jets primarily serve domestic markets, which, outside of China, have come back to 2019 levels. Domestic routes are a commodity service, where airlines basically have minimal pricing power. Domestic service economics, therefore, depend on cost control. When fuel is $100/barrel, if one airline has an Airbus A320Neo or a Boeing 737 MAX and its competitor does not, then the airline with the modern jet can both out-price and out-profit the competition. Thus, single aisles are also benefiting from relatively high fuel prices.
Most other civil segments are quite strong, too. Business jet utilization has been very strong, and used jet availability very low. Backlogs are quite high. Indicators are above 2019 levels, and output is roughly there, too.
The only aerospace market that can be termed weak is twin aisle jetliners. The COVID-19 pandemic hit international traffic first, most and longest. This created a terrible twin aisle overcapacity situation. The growing role of third-party finance made the problem worse for twin aisles, because lessors and other financiers simply prefer to finance single aisles, due primarily to their much larger client base. Meanwhile, the increasing capabilities of new single aisle jets – again, the A320neo and 737 MAX – make them appealing replacements for twin aisles on medium haul international routes, particularly across the Atlantic.
Unfortunately, these twin aisle jetliners are the most composite-intensive civil aircraft, so the composites industry is particularly dependent on military aircraft output. Here, the F-35 continues its slow production ramp and should hit a level of 156 jets per year in the next few years. It will be followed by Northrop’s B-21 Raider stealth bomber, just about to enter production, and the Air Force’s Next Generation Air Dominance combat aircraft program, which should enter production by the end of the decade.
But again, with all of these civil and military programs, for all markets, production output goals are not being met. The problem is worst in the jet engine production system, where castings and forgings represent a significant bottleneck. Many of these are titanium, and the disruption of Russian titanium supplies due to the war – voluntary on the part of Western companies, as Russia hasn’t moved to block exports – has worsened pre-existing supply problems.
Much of the problem comes down to labor. A tight labor market, coupled with the fact that we’ve just been through the first economic recovery to see commercial aviation relatively late compared with other sectors – and therefore late to hire people – has resulted in major delays.
Civil and military aero markets remain strong, and production delays have enforced a kind of discipline on jet manufacturers. Thus, there’s a very good chance that this sector of the economy benefits from a cooling down in other sectors, lowering producer costs and freeing up labor. This implies a relatively benign 18 to 24 months ahead, with respectable growth and lower inflation.
Figure 1: Top Five Aerospace Platforms, Cumulative Deliveries Value
Source: AeroDynamic Advisory
The Glass Fiber Market
By Dr. Sanjay Mazumdar, CEO
Lucintel
Last year was a tale of two halves in the North American composites industry. The industry showed robust growth at the outset of 2022, with January demand up by 5% and February demand up by 10% from a year earlier. Slight improvements in distribution helped to keep performance high, though raw materials and transportation of finished goods remained the biggest challenges in reaching full market demand in the beginning of the year. Marine, construction and infrastructure all performed quite well, and no industry performed particularly poorly in the beginning of 2022.
Conversely, in the second half of the year, the composites market was flat to nearly 7% down in most months compared to a year earlier due to a softening in recreational vehicles, buses, trucks, housing-related products, marine and other sectors. Another factor for decreasing demand in the second half of the year was rising interest rates by the Federal Reserve, which increased interest rates four times in 2022 in an effort to control inflation. So, the significant gains in the first half of the year were washed away in the second half.
Overall, the global glass fiber market grew about 2% in 2022, with demand increasing to 12 billion pounds compared to 11.8 billion pounds in 2021. Most of the major sectors, including construction, electrical and electronics, and automotive grew in 2022.
Global glass fiber capacity reached 13 billion pounds in 2022 from 11.6 billion pounds in 2017, and demand for glass fiber increased from 10.6 billion pounds in 2017 to 12 billion pounds in 2022. The glass fiber plant capacity utilization rate increased from 90% in 2021 to approximately 92% in 2022.
In the future, demand for glass fiber will remain robust, with increasing demand in wind energy, electrical and electronics, automotive, marine and construction. However, there is the possibility of a mild recession in the beginning of 2023 as the Federal Reserve seeks to keep interest rates high this year to control inflation. The main variables are how long inflation will continue and how it will impact investment and consumer behavior.
One of the major challenges that has plagued the composites industry during the past two years is increasing raw materials prices. There are many factors impacting the record-high price increases in fibers and resins, such as post-pandemic consumer demand, increased fuel prices, ongoing supply chain issues, geopolitical events and the war in Ukraine.
Lucintel’s quarterly pricing study suggests that prices for most of the major resins – such as unsaturated polyester resin and epoxy – and major fibers – such as glass fiber and carbon fiber – went up between 20 and 80% in 2021. In terms of competing materials, steel and rebar prices increased 30% to 35% in 2021, and aluminum prices increased 60% in 2021. The good news is that in the second half of 2022, raw material prices started stabilizing or even softened as a result of softening of demands.
Figure 2: Global Glass Fiber Demand and Capacity
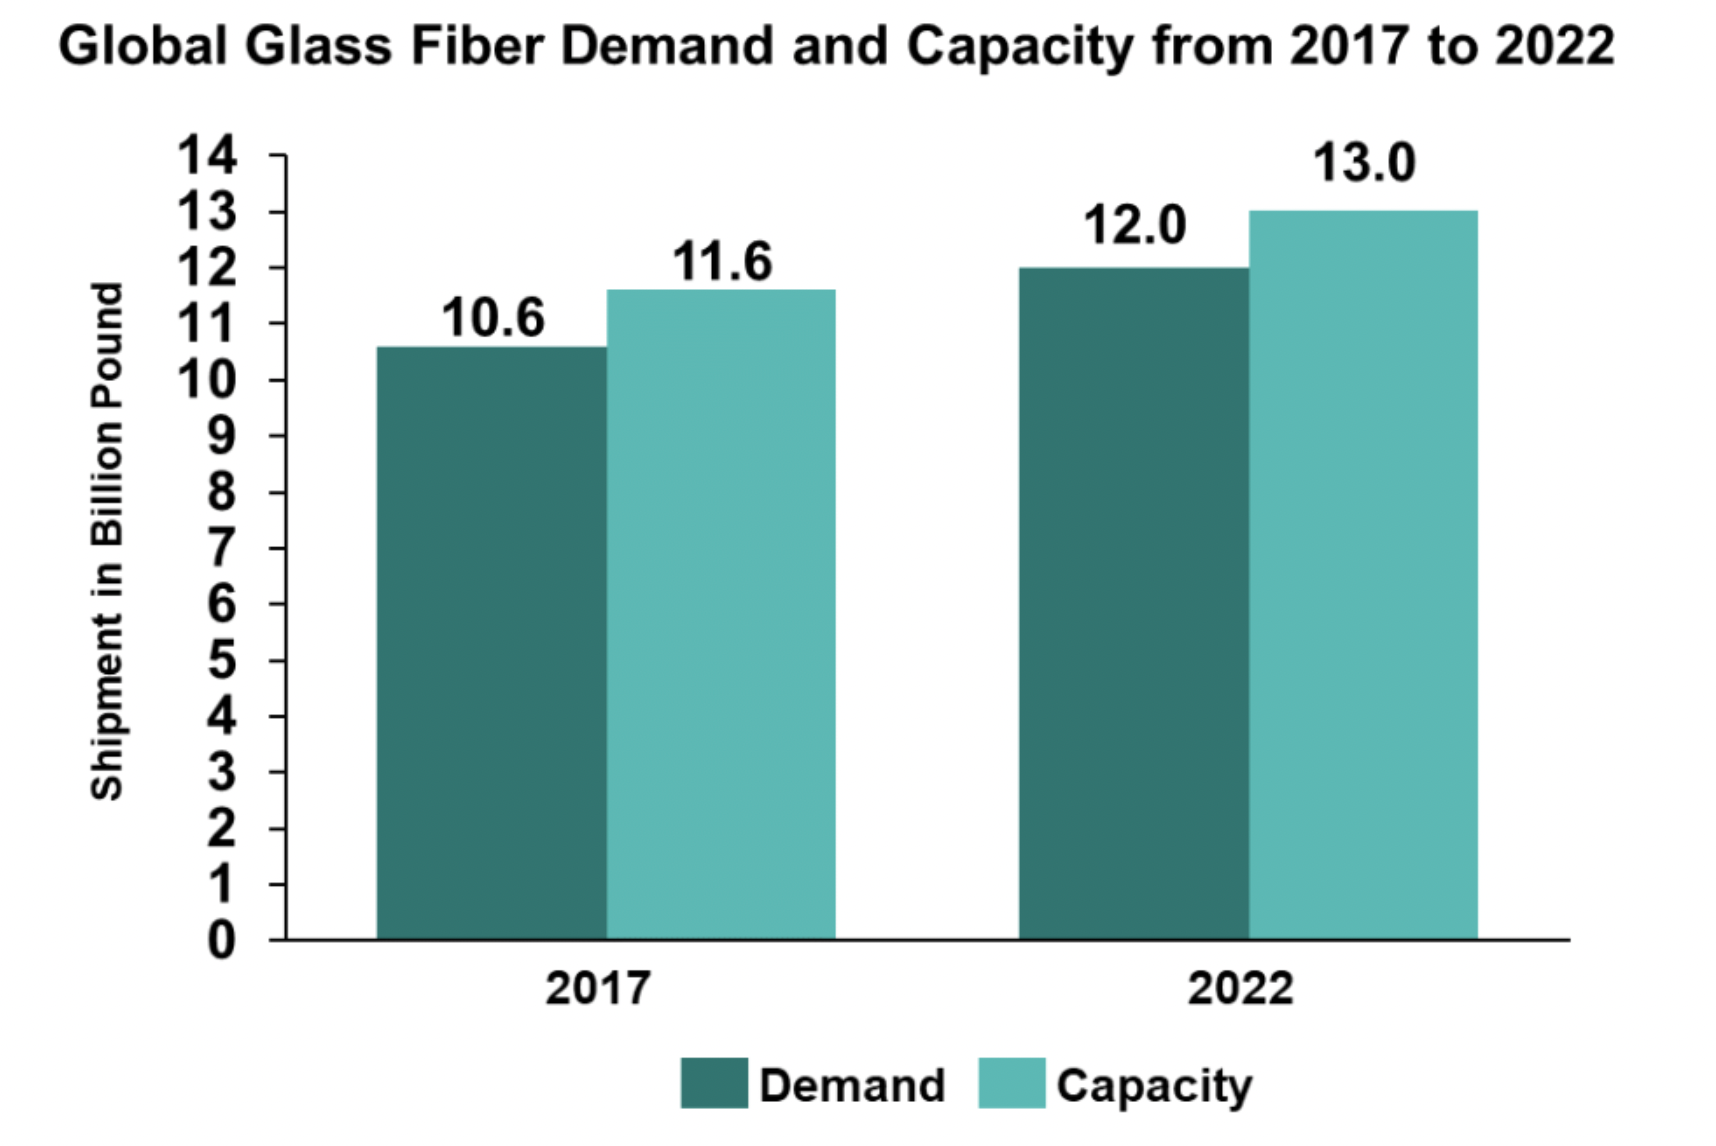
Source: Lucintel
The Automotive Market
By Marc Benevento, President
Industrial Market Insight
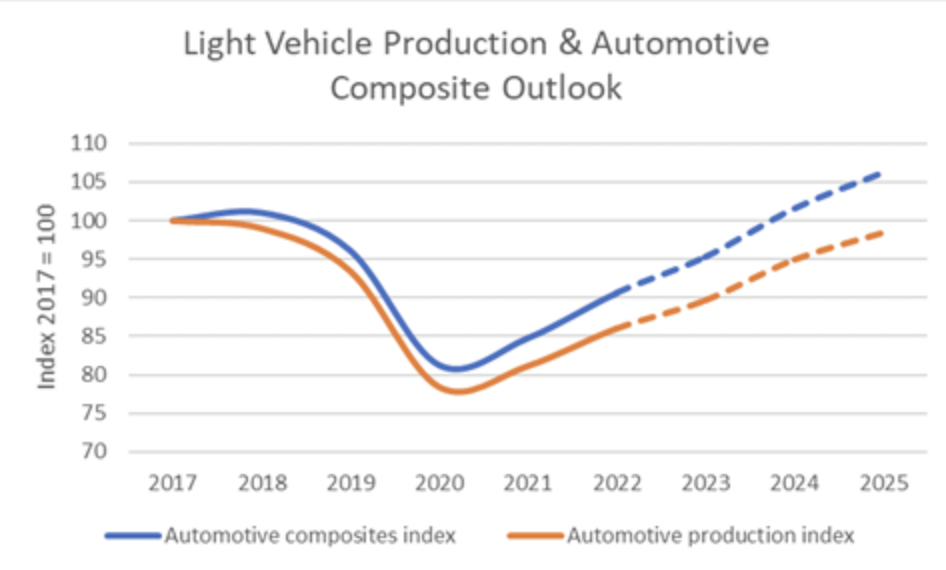
Last year brought an uneven recovery of global light vehicle production, with a 6% year-over-year gain in production that provided suppliers of automotive composites some breathing room while leaving plenty of headspace for future growth. Demand for automotive composites returned commensurately with production, and the need to reduce weight to improve fuel efficiency of internal combustion engines (ICE) and range of battery electric vehicles (BEVs) provides promise for new applications that will drive above-market growth in the future.
The global market for light vehicle composite materials grew to 4 billion pounds in 2022. Although this was nearly a 7% increase from 2021, it remains 10% below the level reached in 2018 due to the significant decline in global vehicle production during the COVID-19 pandemic and semiconductor supply chain disruptions that have delayed market recovery. Global geopolitical issues, such as Russia’s invasion of Ukraine, Brexit and work stoppages in China due to the country’s zero-COVID policy, further complicated matters and led to a very uneven volume recovery in major global production centers.
In 2022, light vehicle production growth, and therefore automotive composites growth, was strongest in North America, which saw a 12% increase in vehicle production. China’s production grew 6%, which, due to the number of vehicles produced there, contributed nearly equally to incremental volume growth. Production volume in Europe declined slightly and rose only slightly in Asia outside of China, resulting in 6% growth of global vehicle production, which was slightly outpaced by growth in automotive composites.
On the bright side, the uneven recovery in 2022 leaves headspace for growth in 2023, when 5% growth of light vehicle composites is expected, driven by 4% vehicle production growth. This growth is expected to be more evenly distributed across global manufacturing centers in the coming year, with mid-single digit growth forecast for North America, Europe and most of Asia. Despite this growth, it will likely take an additional year or two for global automotive composite demand to return to the level of 2018. This can be seen in the growth index, where a value of 100 is equal to 2017 global market volume of composites and vehicles produced.
Although the industry is on the precipice of a shift to electric vehicles, it is very much in a transitional state, with ICE powertrains dominating the mix. In 2021, battery electric vehicles represented less than 10% of vehicles sold globally, with 85% of all BEV sales occurring in China and Europe. Fewer than 5% of vehicles sold in the United States in 2021 were BEVs. Hybrid electric vehicles continue to see significant growth in North America since they improve fuel economy while alleviating the range anxiety consumers associate with BEVs.
Automotive composites will continue to grow based on the value offered in terms of cost, weight and performance versus other materials. The need to reduce vehicle weight has never been greater, both to improve the efficiency of ICE vehicles as well as to maximize the range of BEVs. For parts such as battery trays, composites offer the potential to reduce part count and lower weight versus metals, while offering superior corrosion resistance and fire suppression at a competitive cost. Of course, as BEVs gain market share, parts like GFRP intake manifolds and valve covers will begin to disappear.
Last year brought some much needed recovery to global light vehicle production, which will continue through 2023, driving volume growth of automotive composites in the short-term. In the longer-term, the changing mix of vehicle drive technology will bring both opportunities and challenges for suppliers of automotive composite materials.
Figure 3: Light Vehicle Production Vs. Composite Consumption Index
Source: Industrial Market Insight
The Carbon Fiber Market
By Dr. Sanjay Mazumdar, CEO
Lucintel
After two years of sluggish performance in 2020 and 2021, the carbon fiber industry rebounded last year. In 2022, the global carbon fiber industry grew approximately 9% in terms of volume to reach 191 million pounds ($3.6 billion). The dollar value of carbon fiber shipments increased about 27% in 2022 as the price of carbon fiber rose approximately 20% in 2022 compared to 2021.
Before the COVID-19 pandemic, there was a declining trend in carbon fiber prices, but that trend got disrupted due to geopolitical issues and the Russian invasion of Ukraine, which has increased the price of natural oil and gas, as well as various raw materials.
Lucintel forecasts that demand within the global carbon fiber industry will increase by about 7% compound annual growth rate (CAGR) in terms of volume from 2023 to 2028 for several reasons, including the growth of carbon fiber applications in wind turbine blades, a resurgence in aircraft deliveries, light vehicle production and demand for sporting goods, recreational vehicles and electrical and electronic products.
One country to keep an eye on is China, which is heavily investing in the carbon fiber market. For instance, Sinopec started China’s first production line of large tow carbon fiber, with 10,000 tons of production capacity. On several visits to China, I found that companies are innovating and disrupting various end-use industries by using carbon fiber. There are hundreds of CFRP parts manufacturing companies in China. In addition, China strives to lead the robot and drone market, which will have significant potential for carbon fiber in the future.
Another trend that will impact the carbon fiber market is growing interest in the hydrogen economy, with its vision to use hydrogen as a low-carbon energy source. Both hydrogen vehicles and electric vehicles pave the way for a cleaner and greener environment on the road. But unlike electric vehicles, which take a fair amount of time to recharge, hydrogen vehicles can be refilled quickly from a refueling station like a petrol or diesel car. Fuel cells can be used to power passenger cars, heavy-duty trucks, buses, forklifts, aircrafts and other transportation vehicles.
In 2022, global demand for fuel cell cars represented only 0.03% of total vehicle sales due to lack of a robust hydrogen infrastructure. Moreover, not many hydrogen fuel-cell car options are available to consumers in various part of the world. The good news is that demand for fuel cell cars has grown rapidly in recent years. If the trend continues, then demand for carbon fiber will also grow swiftly as carbon fiber is used in fuel cells, electrolyzers and hydrogen tanks.
Circular economy trends, focused on the reuse and regeneration of materials and products, will also impact the growth of carbon fiber in the future. In terms of sustainability, carbon fiber parts offer significant weight savings, thus reducing fuel consumption and greenhouse gas emissions. But recycling carbon fiber parts at their end of life poses a challenge. Lucintel studies point to many examples where carbon fiber is recycled from process waste, but it is not currently recycled at the end-of-life cycle.
There is mounting pressure on material suppliers and part fabricators to engage in sustainability practices that support a circular economy. OEMs – whether in automotive, wind energy or aerospace – are looking to hear a good circular economy story of carbon fiber and carbon fiber parts. Most OEMs have targets of becoming carbon neutral between 2030 to 2050, and they have already started considering recycling as part of their design criteria for the next generation of parts manufacturing. Material and parts suppliers that enable OEMs to achieve circular economy targets by utilizing innovative technologies and materials will gain market share in the future.
The Construction/Infrastructure Market
By Ken Simonson, Chief Economist
Associated General Contractors of America
A major shift is underway for construction segments. The new leaders and laggards have significant implications for demand for composites.
Single-family homebuilding, the largest segment in terms of construction spending and employment, has made a sharp U-turn. According to the U.S. Census Bureau, spending on single-family construction climbed 76% over 22 months from its COVID-19 pandemic low in June 2020 until topping out in April 2022. But spending tumbled by 15% over the next six months. Data on building permits, starts and sales all point to further steep declines for the next several months. A major reason for the abrupt downturn is the sharp increase in interest rates, along with fast-rising house prices that have left many would-be homebuyers unable to afford the purchase price, monthly carrying costs or both.
The run-up in interest rates also spells trouble for income-producing property categories. Developers of retail, warehouse, office and hotel properties are facing higher financing and construction costs. They need higher rents (or hotel room rates) for these projects to make sense financially. As the economy cools and resistance grows to paying higher rents, more of these project types are likely to be suspended or canceled.
But three market segments are poised to expand by more than enough to offset these negative changes: manufacturing, infrastructure and power-related construction. Fortunately, these segments are somewhat less sensitive than income-producing property types to short-term interest rate increases.
Manufacturing construction spending, measured at a seasonally adjusted annual rate, bottomed out in January 2021 but soared more than 50% by October 2022. (Seasonal adjustment is a statistical method to remove the variation due to regularly recurring patterns, such as normal weather or holidays.)
Spending on manufacturing plants, which set new records in eight of the first 10 months of 2022, seems sure to go even higher, based on recent announcements and groundbreakings. Unprecedented amounts of spending are occurring for semiconductor manufacturing facilities; automotive assembly, battery and parts plants; and factories to supply components for renewable energy projects. Passage of the CHIPS and Science Act last August will heat up the manufacturing construction market even more.
The energy projects cover a range of electricity generation, storage and battery charging facilities. Investment is being driven, so far, by state mandates and incentives, plus the desire of private customers to lessen dependence on fossil fuels. Project demand might increase further if investors decide the tax credits and other incentives in the recently enacted Inflation Reduction Act are sufficient.
A third piece of federal legislation, the Infrastructure Investment and Jobs Act of 2021, should give a boost to several categories of infrastructure construction, including highways, transit, rail, broadband, water and wastewater. However, the timing of contract awards – and therefore spending – remains uncertain. Agencies must provide clearer guidance about domestic content requirements and waivers under the law’s Build America, Buy America Act and other provisions.
The construction industry continues to experience challenges from high and volatile materials costs, selective supply-chain bottlenecks and a chronic shortage of qualified workers. Overall, materials costs are not rising as fast as they did earlier. The producer price index for inputs to new nonresidential construction, a weighted average of all materials and service such as trucking and design services, rose at a 20% or higher annual rate for 12 straight months ending in April 2022. By October, the rate had tapered to 11%. But that was still much hotter than the 7.7% rise in the consumer price index, and it appears likely to continue outpacing consumer inflation in 2023.
Lead times have shortened for many materials, but others have worsened. Notably, in October, the Portland Cement Association reported shortages in 43 states for cementitious material, including fly ash and slag, as well as cement. As a result, construction projects are taking longer to complete, driving up costs. Electrical items such as transformers also are experiencing exceptionally long back orders.
Labor availability remains the top concern for many construction firms. The need to attract more workers, pay more overtime to current employees to cover the shortfall and invest in laborsaving equipment will drive construction costs higher in 2023 and beyond.
In summary, the market for construction is evolving rapidly. But many of the impediments remain the same.
Figure 4: Change in Construction Spending, October 2021 to October 2022
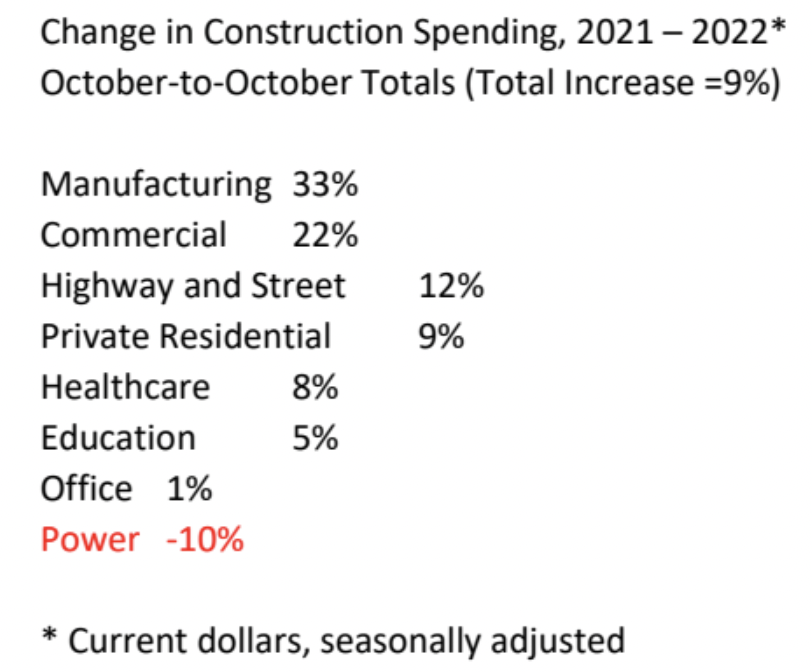
Source: Author’s calculations from U.S. Census Bureau, www.census.gov/constructionspending

Vectorply combines highly engineered composite reinforcements w/ industry-leading engineering & technical support to help customers achieve their production goals.

A lower-cost “print only” line of machines built around proven LSAM technology
More from Composites Magazine


A New Year Brings New Strategy for Biden Administration’s Commitment to “Green”

SUBSCRIBE TO CM MAGAZINE
Composites Manufacturing Magazine is the official publication of the American Composites Manufacturers Association. Subscribe to get a free annual subscription to Composites Manufacturing Magazine and receive composites industry insights you can’t get anywhere else.